Weather is unpredictable and, in many parts of the country, can change in an instant. Severe storms can happen during any season, so it’s important to prepare your home for major weather events to prevent damage and avoid costly home repairs.
Using information from First Street Foundation and ClimateCheck, to provide comprehensive climate risk information for every zip code, neighborhood, city, and county in the contiguous U.S.
Ready to find your dream home?
It’s that easy. Let us put our experience to work for you.
Storm Risk Frequently Asked Questions

Does my homeowner’s insurance cover storm damage?
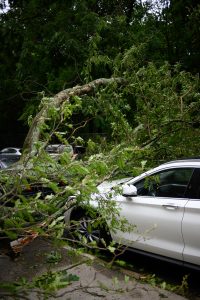
Homeowner’s insurance can provide peace of mind, and a typical homeowner’s policy will cover exterior and interior storm damage. In addition, if you experience a tornado, major windstorm, power surge, lightning strike, fallen tree, hail damage, ice storm, or wildfire, most policies will cover a portion of repair or replacement after you’ve met your deductible.
On the exterior, covered storm damage can include:
– Roof shingles which have blown off during a windstorm
– Siding dented from hail.
In the interior, it can include:
– Power surges caused by a lightning strike that causes wiring damage to appliances.
Do I need a storm door?
How to build a storm shelter?
How to prepare for a winter storm?

What to do after storm damage?
Once you’re certain you and your household members are safe and unharmed, take the necessary precautions to avoid injuries. Watch out for broken glass, nails, displaced screws, power lines, and unsecured piles of debris. Next, assess the storm damage and take photos of the destruction, including the interior and exterior of your home.
To prevent further storm damage, cover broken windows and roof leaks with tarp or plywood. After you’ve taken steps to minimize further damage, call your insurance agent. The insurance company will likely reach out to contractors and schedule the work directly to avoid any scams. Don’t forget to take good documentation for claims to your homeowner’s insurance and save all receipts to receive reimbursement.
The Top 10 U.S. Cities Most at Risk of Storms
| Rank | City | Storm risk rating | Avg # of storms (historical) | Avg precipitation per storm (inches), historical | Avg # of storms in 2050 | Avg precipitation per storm (inches), 2050 |
|---|---|---|---|---|---|---|
| 1 | Atlanta, GA | 81 | 8 | 2.2 | 23 | 2.6 |
| 2 | Pittsburgh, PA | 81 | 8 | 1.4 | 26 | 1.7 |
| 3 | Louisville, KY | 80 | 8 | 2.0 | 23 | 2.4 |
| 4 | Portland, OR | 79 | 8 | 2.0 | 24 | 2.3 |
| 5 | Raleigh, NC | 79 | 8 | 1.9 | 24 | 2.4 |
| 6 | Seattle, WA | 78 | 8 | 2.0 | 25 | 2.4 |
| 7 | Lexington-Fayette, KY | 78 | 8 | 1.5 | 23 | 1.9 |
| 8 | Philadelphia, PA | 77 | 8 | 2.2 | 23 | 2.5 |
| 9 | Boston, MA | 76 | 8 | 2.2 | 23 | 2.6 |
| 10 | Cincinnati, OH | 75 | 8 | 1.8 | 23 | 2.6 |
Interested in moving out of these areas of major storms?
It’s that easy. Let us put our experience to work for you.
*Storm risk is measured by considering the amount of precipitation that falls on the most rainy (or snowy) days. A “storm” is defined as the amount of precipitation in the top 8 rainiest days per year in a location, based on historical averages. The storm risk rating considers how many more of these days will occur on average around 2050, and how much more precipitation will fall on these rainiest days.


